Subharmonics and Low-Frequency Phase Statistics
As explained in Sec. 9.3 of my book, the standard Fourier Transform (FT) method for generating random phase screens often fails to accurately represent the large-scale statistics of atmospheric turbulence. This deficiency is most apparent when examining the structure function at large spatial separations. This article provides updated code to generate phase screens using the ftShGaussianProc2 function that is used in the script checkXcorr2.m from Unbiased Correlation of 2-D Random Processes and the script checkStrFcn2.m from Unbiased Structure Function of 2-D Random Processes.
The Spectral Sampling Problem
As explained in Sec. 9.3, the Fourier transform (FT) method samples the Power Spectral Density (PSD) on a discrete grid with a frequency spacing of \(\Delta f = 1/D\), where \(D\) is the side length of the grid. Because the grid cannot sample frequencies lower than \(\Delta f\), it inherently misses the tilt and other low-frequency content that characterize Kolmogorov turbulence. This results in an underestimation of the phase variance and a structure function that "flatlines" prematurely. In beam propagation simulations, the mean beam irradiance is too narrow, and the scintillation variance is too low.
The Subharmonic Solution
To recover these missing low frequencies, we utilize the subharmonic method. This approach samples the PSD on increasingly finer grids centered at the origin of the frequency plane. By partitioning the spectrum and carefully avoiding double-counting the DC power, we can synthesize a low-frequency screen (\(\phi_{lo}\)) to augment the high-frequency FT screen (\(\phi_{hi}\)).
Visual and Statistical Comparison
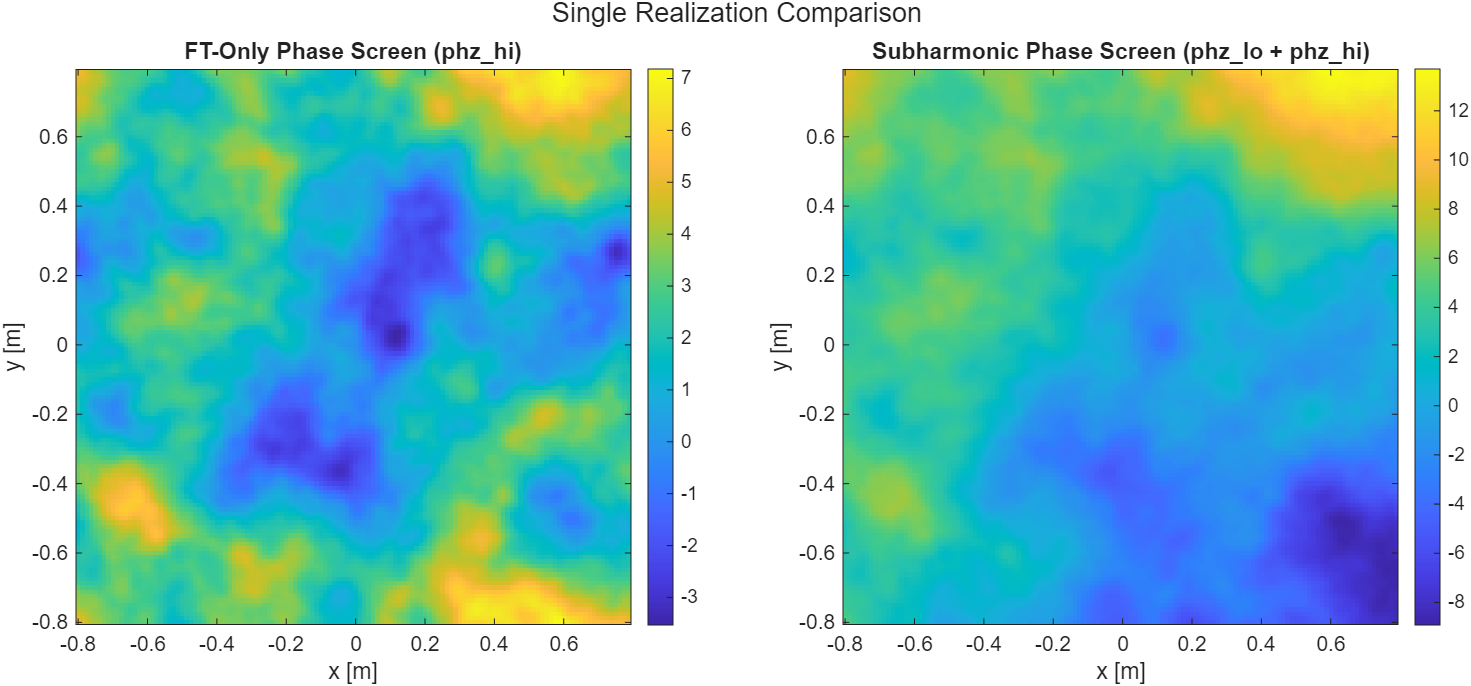
Just like Fig. 9.3, the script below demonstrates the benefit of adding subharmonics to the FT screen. In Fig. 1, the visual difference between a screen generated with only the high-frequency components versus one including subharmonics is clear. However, note that this implementation of the subharmonic method is not perfect, but it performs much better than the FT method alone. When I wrote the book, this method provided the best combination of simplicity and accuracy for instructional purposes. In the years since the book was published, even more phase screen generation methods have been published with a variety of benefits over both the FT and subharmonic methods.
Statistically, the impact is even more quantifiable. By computing the unbiased structure function, we can compare both methods against the theoretical von Karman model: $$D_\phi(r) = 6.16 r_0^{-5/3}\left[\frac{3}{5}\kappa_0^{-5/3} - \frac{\left(r/\kappa_0/2\right)^{5/6}}{\Gamma\left(11/6\right)} K_{5/6}\left(\kappa_0 r\right)\right],$$ as shown in Fig. 2.
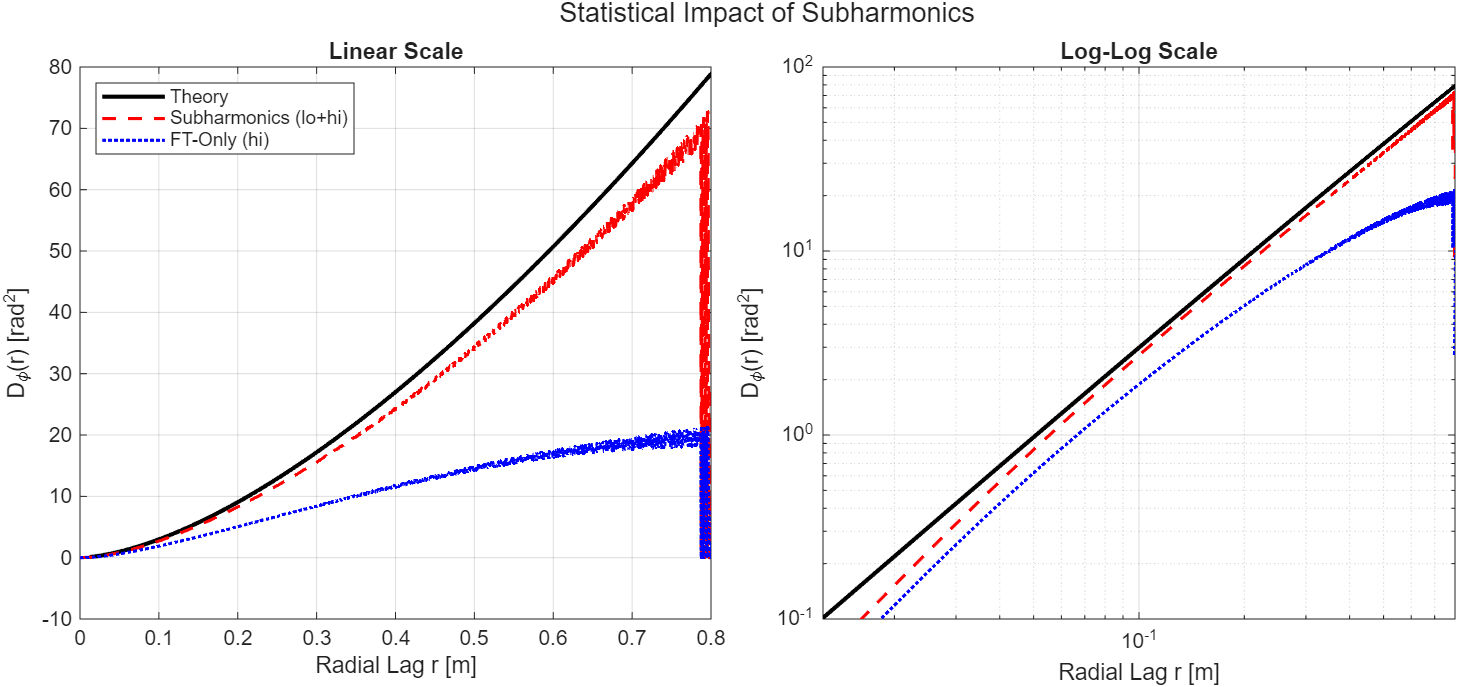
As demonstrated in Fig. 2, some kind of low-frequency addition is essential for any simulation where large-scale phase effects, such as beam wander or arrival-angle fluctuations, are of interest.